How to Research a Suburb Before Buying Property in Australia
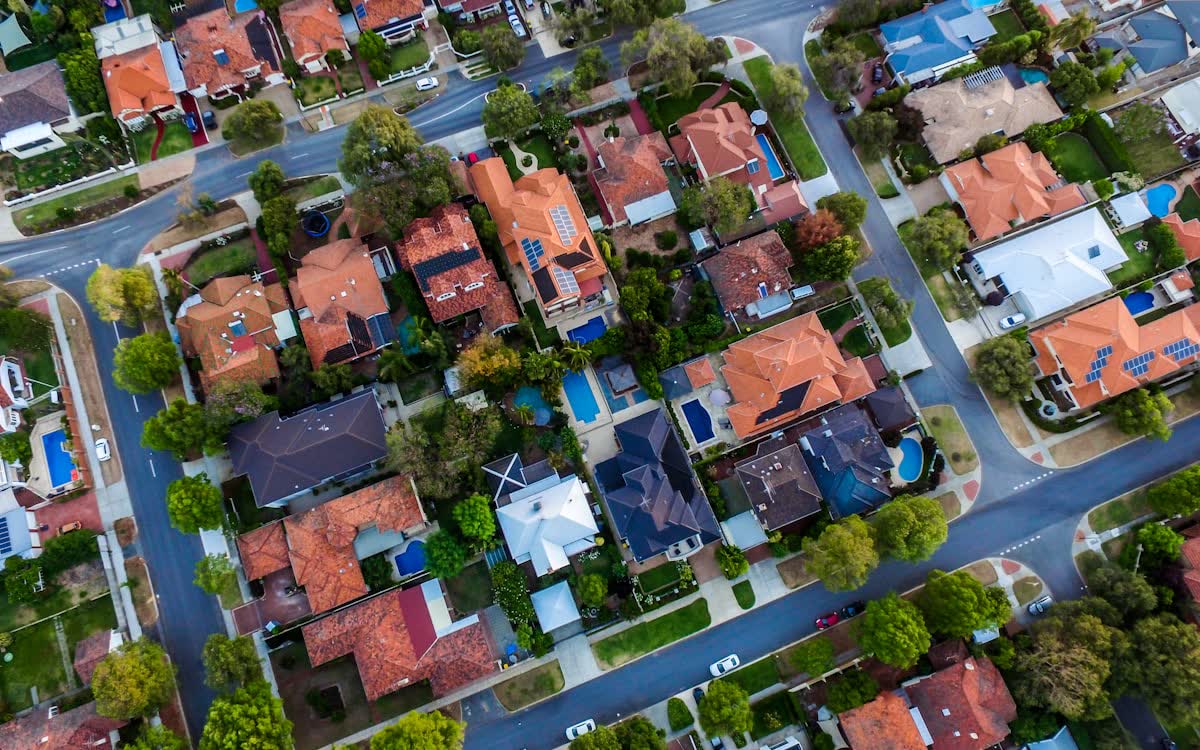
Buying a property is the biggest financial decision most Australians make. Yet many buyers research the property itself — bedrooms, bathrooms, renovation potential — far more than they research the suburb it sits in.
The suburb determines your lifestyle, your commute, your children's schools, your safety, and ultimately your property's long-term value. A great house in the wrong suburb is a bad investment. An average house in a great suburb is usually a good one.
Here's how to research a suburb properly before committing hundreds of thousands of dollars.
The data that actually matters
1. Population and demographic profile
Understanding who lives in a suburb tells you what the suburb is like to live in and where it's heading.
What to look for:
- Population growth — suburbs growing faster than the city average are attracting residents for a reason (infrastructure, affordability, amenity). Strong growth also supports property values.
- Age distribution — a suburb dominated by young families has a very different character from one with a high proportion of retirees or young professionals.
- Household composition — the mix of couples with children, couples without children, lone-person households, and group households shapes everything from local amenities to noise levels.
- Median household income — this indicates the economic profile of residents and correlates with property values, local business quality, and council investment.
- Country of birth and languages spoken — indicates cultural diversity and can signal the presence of specific community amenities (restaurants, cultural centres, religious institutions).
Where to find it:
- ABS Census data (most comprehensive, updated every 5 years)
- SuburbIQ — aggregates census data across 16,000+ Australian suburbs with interactive dashboards and comparison tools
- Profile.id — demographic profiles for many LGAs
- Your state's planning department population projections
2. Crime statistics
Crime data is one of the most researched — and most misunderstood — suburb metrics. Headlines about "dangerous suburbs" rarely reflect the nuanced reality.
What to look for:
- Offence types, not just totals — a suburb with high property crime but low violent crime is very different from one with the opposite pattern. Focus on the categories that matter most to you.
- Trends over time — is crime increasing, decreasing, or stable? A suburb with declining crime rates may be a better bet than one with historically low but increasing rates.
- Rate per population — raw crime numbers are meaningless without population context. A suburb with 500 offences and 50,000 residents is safer than one with 200 offences and 5,000 residents.
- Comparison to similar areas — how does this suburb's crime rate compare to neighbouring suburbs or the LGA average?
Where to find it:
- Victoria: Crime Statistics Agency (crimestatistics.vic.gov.au)
- NSW: BOCSAR (bocsar.nsw.gov.au)
- Queensland: Queensland Police Service (mypolice.qld.gov.au)
- WA: WA Police Force (police.wa.gov.au)
- SuburbIQ — aggregates crime data from multiple states into one searchable interface with 19 years of historical data
Common mistake: Dismissing a suburb based on a single year's crime data. Crime statistics fluctuate year to year. Always look at the 3-5 year trend.
3. Schools
Even if you don't have children, school quality significantly affects property values. Suburbs within highly-rated school catchments consistently command premium prices.
What to look for:
- Government school catchment zones — which schools would your children attend? Check the specific catchment, not just proximity.
- School type and sector — government, Catholic, independent. The availability of choice matters.
- Enrolment numbers and trends — a school at 120% capacity is a different proposition from one at 70% capacity.
- NAPLAN results — not a perfect measure, but useful for comparison when combined with other factors.
- Specialist programs — SEAL (Select Entry Accelerated Learning), music programs, sports academies can be significant for some families.
Where to find it:
- MySchool (myschool.edu.au) — NAPLAN results, enrolment data, and school profiles
- State education department websites for catchment zone maps
- SuburbIQ — school data by suburb including type, sector, and location
4. Transport and commute
Your daily commute will define your quality of life more than almost any other factor. A suburb with a 25-minute train commute to the CBD is a fundamentally different proposition from one requiring 75 minutes by car.
What to look for:
- Train/tram/bus access — distance to the nearest station or stop, frequency of service, direct routes to your workplace.
- Drive time to work — check during peak hours, not off-peak. Use Google Maps with the "depart at" feature set to 8am on a weekday.
- Road infrastructure — proximity to freeways, arterial roads, and planned road upgrades.
- Future transport plans — planned rail extensions, bus route changes, or major road projects can significantly impact a suburb's accessibility and property values.
Where to find it:
- Google Maps (real-time traffic data)
- PTV (Victoria), Transport NSW, TransLink (Queensland) for public transport planning
- State government infrastructure plans
5. Property market fundamentals
Beyond the individual property, understand the suburb's broader market dynamics.
What to look for:
- Median house/unit price — and the trend over 1, 3, 5, and 10 years.
- Days on market — how quickly do properties sell? Lower days on market indicates stronger demand.
- Auction clearance rate — higher clearance rates indicate a seller's market.
- Rental yield — gross rental yield indicates investment demand. Suburbs with strong yields attract investors, which affects the market differently from owner-occupier-dominated suburbs.
- Median rent — if you're buying an investment property, this directly determines your returns.
- New development pipeline — significant new supply (apartments, subdivisions) can suppress price growth and increase rental competition.
- Vacancy rates — low vacancy rates indicate strong rental demand.
Where to find it:
- CoreLogic, Domain, REA Group for property market data
- SQM Research for vacancy rates
- SuburbIQ — median house/unit prices, rental data, and yields by suburb
- Council planning portals for development applications
6. Local amenities and lifestyle
Data only tells part of the story. The character of a suburb — its feel, its community, its amenities — requires boots on the ground.
What to check in person:
- Cafes, restaurants, and retail — the quality and variety of local businesses indicate the suburb's economic health and lifestyle appeal.
- Parks and green spaces — proximity to parks, walking trails, sporting facilities.
- Medical services — GPs, dentists, pharmacies, hospitals. Particularly important for families and older residents.
- Shopping — daily essentials within walking distance? Major shopping centres within a short drive?
- Community feel — visit on a Saturday morning. Are people walking? Are there markets, events, activity? Or is it quiet and car-dependent?
Visit at different times:
- Saturday morning for community feel
- Weekday evening for traffic and noise
- Friday/Saturday night if nightlife or noise is a concern
- School drop-off/pick-up time if you have children
7. Planning and development outlook
What a suburb looks like today may not be what it looks like in 5-10 years. Planning decisions made now will shape its future.
What to look for:
- Zoning — is the area zoned for residential growth? Are there areas being rezoned for higher density?
- Major development applications — large apartment complexes, shopping centres, industrial developments can significantly change a suburb's character.
- Infrastructure projects — new schools, hospitals, train stations, road upgrades. These generally increase property values in surrounding areas.
- Heritage overlays — heritage protections can preserve character but limit development and renovation options.
Where to find it:
- Council planning portals for development applications and strategic plans
- State government infrastructure plans
- Planning scheme maps (available through council or state planning departments)
How to compare suburbs systematically
Most buyers have a shortlist of 3-5 suburbs. Comparing them systematically prevents emotional decision-making.
Create a simple comparison matrix:
| Factor | Suburb A | Suburb B | Suburb C |
|---|---|---|---|
| Median house price | |||
| 5-year price growth | |||
| Population growth | |||
| Median household income | |||
| Crime rate (per 1,000) | |||
| School catchment rating | |||
| Train commute to CBD | |||
| Drive commute to work | |||
| Rental yield | |||
| Lifestyle/amenity score |
Weight each factor based on your priorities. A family with school-age children weights school catchment heavily. An investor weights yield and population growth. A young professional weights commute time and lifestyle.
Using data platforms to speed up research
Manually gathering all this data from different sources takes days. Data platforms that aggregate multiple datasets into one searchable interface can compress this to hours.
SuburbIQ brings together census demographics, crime statistics, rental data, school information, population data, and more across 16,000+ Australian suburbs across 8 states and territories. You can:
- Search for any suburb and see a comprehensive data dashboard
- Compare suburbs side by side across any metric
- Explore choropleth maps to see how metrics vary geographically
- Ask questions in plain English ("compare median income in Hawthorn vs Richmond")
It doesn't replace visiting the suburb in person or doing property-specific due diligence — but it handles the data-gathering phase that would otherwise take days of spreadsheet work.
Explore suburbs on SuburbIQ → — free to use.
The bottom line
Researching a suburb isn't complicated, but it is time-consuming when done properly. The key principles:
- Look at data, not just feel — a suburb that "feels nice" on a Saturday afternoon might have declining demographics, rising crime, or poor schools.
- Prioritise trends over snapshots — where a suburb is heading matters more than where it is right now.
- Compare systematically — gut feel is useful, but a structured comparison across consistent metrics leads to better decisions.
- Visit in person — data tells you what a suburb looks like on paper. Only visiting tells you what it's like to live there.
- Consider the 10-year view — you're buying into a suburb's future, not just its present. Infrastructure plans, population projections, and development pipelines matter.
The suburb you choose will shape your daily life for years. It's worth spending a few days researching properly before spending half a million dollars.